Module 3 · pandas Quick Start
Group, Join and Chart
Summarise data with groupby, join tables with merge, and turn the answers into charts you can share.
About 25 minutes
Open in ColabEvery example as a notebook you can run, edit and save to your Google Drive.
Summarise with groupby
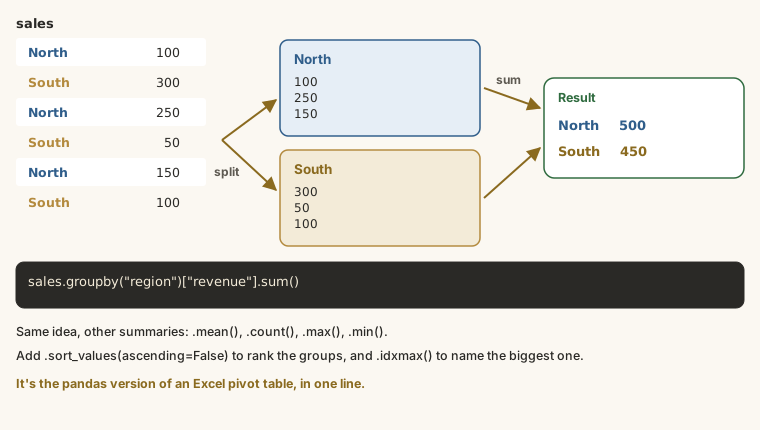
groupby is the pandas version of a pivot table. Total revenue by year:
Edit the code and press Run (Ctrl + Enter). Examples on this page share their variables, like cells in a notebook.
Revenue by month, then the best and worst months:
Edit the code and press Run (Ctrl + Enter). Examples on this page share their variables, like cells in a notebook.
Join tables with merge
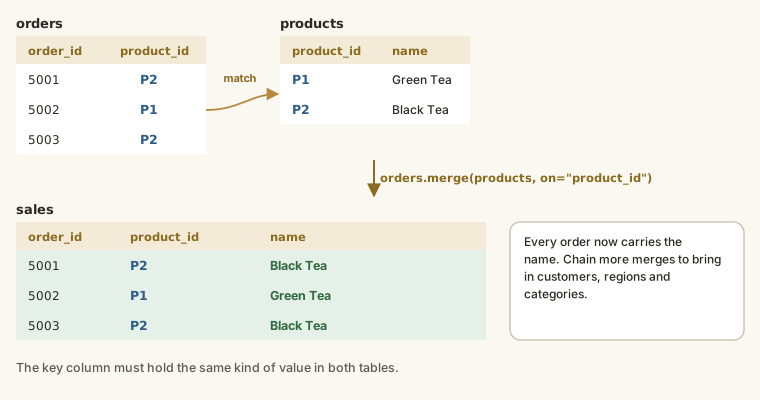
The orders table only has product_id and customer_id. The names, categories and regions live in two other tables. Load them and merge:
Edit the code and press Run (Ctrl + Enter). Examples on this page share their variables, like cells in a notebook.
merge matches rows where the key column has the same value, like a lookup in Excel.
Answer business questions
Edit the code and press Run (Ctrl + Enter). Examples on this page share their variables, like cells in a notebook.
| Category | Revenue |
|---|---|
| Household | ₦244,769,040 |
| Personal care | ₦235,483,370 |
| Beverages | ₦224,612,360 |
| Snacks | ₦125,676,475 |
Edit the code and press Run (Ctrl + Enter). Examples on this page share their variables, like cells in a notebook.
Lagos brings in ₦411,162,300, about half of all revenue, followed by South West and North West.
Make charts
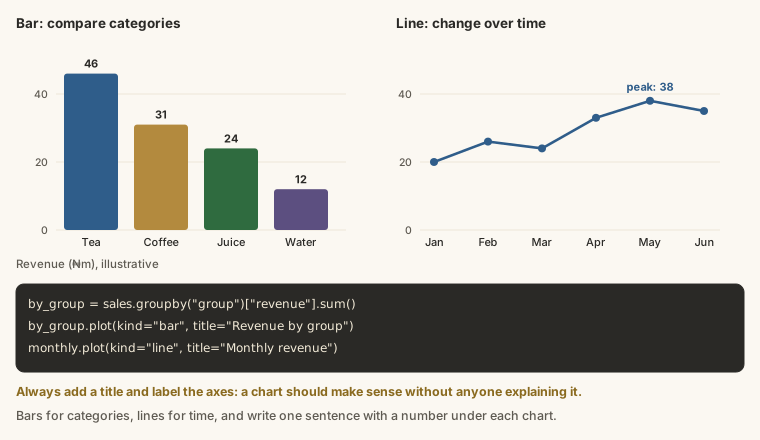
pandas can draw charts directly:
Edit the code and press Run (Ctrl + Enter). Examples on this page share their variables, like cells in a notebook.
Edit the code and press Run (Ctrl + Enter). Examples on this page share their variables, like cells in a notebook.
Use kind="barh" for comparing categories and a line (the default) for trends over time.
Share your analysis
Add text cells to explain what you found in plain words, not just code. Then save the notebook to GitHub (File → Save a copy in GitHub) or share the Colab link. That's a portfolio project.
Try it
Use the merged sales table.
Practice
Which channel brings in the most revenue?
Practice
Which product (product_name) brings in the most revenue?
Task
12 minMake a bar chart of revenue by region and a line chart of monthly revenue. Then write three sentences for a manager summarising what they show, with at least two numbers.
Your work is checked for
- Three sentences
- At least two numbers
- Mentions a region
- Says something about change over time (month, December, grew, fell, peak…)
- Written for a manager, not code (no brackets or underscores)
Then save the notebook to GitHub (File → Save a copy in GitHub) or share the Colab link with a text cell at the top explaining what it does.
Earn your badge
Take the module check
Questions on this module. Pass and you earn the Python Data Insights badge, free.
Create a free account to earn the badge