Module 6 · Data Analytics Foundations
Data analysis
The calculations behind most business analysis, one at a time: totals, distinct counts, mean, median and mode, shares, growth, percentage points and rates, and the traps in each.
About 25 minutes
The problem
Kolanut's data is clean. Now the managing director asks: "Did we do better in the first half of 2026 than the first half of 2025, and where did the money come from?"
Answering needs only a few calculations, used carefully. Most business analysis is built from the same small toolkit.
The concept
Most business analysis is built from a small toolkit of calculations. The skill isn't the arithmetic; it's choosing the right one and knowing its traps.
Revenue at Kolanut is calculated per order line as:
revenue = quantity × unit_price × (1 − discount_pct ÷ 100)
The toolkit
| Calculation | What it tells you | How |
|---|---|---|
| Total | How much, overall | Add the values |
| Count | How many | Count the rows |
| Distinct count | How many different things | Count each value once |
| Average (mean) | Total spread evenly | Total ÷ count |
| Median | The middle value | Sort, take the middle one |
| Mode | The most common value | The value that appears most |
| Minimum, maximum, range | The extremes, and how far apart | Smallest, largest, largest − smallest |
| Share of total | How much one part contributes | Part ÷ total × 100 |
| Growth rate | How much something changed | (New − old) ÷ old × 100 |
| Rate per | A fair comparison of different-sized groups | Total ÷ size of group |
The sections below take them in turn, each with Kolanut's real figures.
Totals, counts and distinct counts
| Question | Calculation | Answer |
|---|---|---|
| How much revenue, January 2025 to June 2026? | Total of revenue | ₦830,541,245 |
| How many order lines? | Count of rows | 4,266 |
| How many different customers ordered? | Distinct count of customer_id | 90 |
| How many different products were sold? | Distinct count of product_id | 16 |
A count and a distinct count answer different questions: 4,266 order lines came from 90 customers. Mixing them up is a common source of wrong numbers in reports.
Mean, median and mode
Three ways to describe a "typical" value:
| Measure | How | Kolanut order lines |
|---|---|---|
| Mean | Total ÷ count | ₦194,689 per line |
| Median | The middle value, when sorted | ₦166,680 per line |
| Mode | The most common value | 5 packs is the most common quantity (226 lines) |
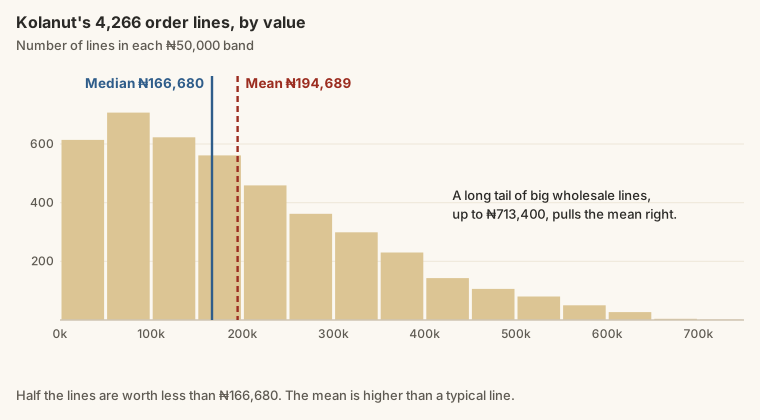
Why do the mean and median differ? Most lines are small or medium, but a long tail of big lines (405 of the 411 lines worth ₦400,000 or more are wholesale) pulls the mean up. The median only cares about the middle, so the tail doesn't move it.
Which to use?
- When values are roughly symmetric, mean and median are close; use the mean.
- When a few values are much larger than the rest (salaries, order sizes, house prices), the median is the fairer "typical" figure. Report both when they differ a lot.
- The mean is still the right one when you need totals: mean × count = total. You can't do that with a median.
Minimum, maximum and range
The extremes are a quick sanity check as well as a fact. Kolanut's order lines run from ₦3,420 (one pack of bottled water with 5% off) to ₦713,400 (29 packs of body lotion). Quantities run from 1 to 30 packs.
Always look at the minimum and maximum of every number column before analysing. A negative quantity, a price of zero, or a date in 2099 tells you there's cleaning to do.
Share of total
Share = part ÷ total × 100. It answers "how much of the whole does this part make up?"
Shares let you compare parts of very different sizes, and they always add up to 100%, which makes a good check.
Growth rate
Growth = (new − old) ÷ old × 100. Divide by the old value: the starting point.
Growth can be negative (a fall). Report a fall as a fall: "fell 46.6%", not "grew −46.6%".
Rates: comparing groups of different sizes
Lagos brings in far more revenue than South South, but it also has far more customers: 34 against 11. To compare fairly, divide by the size of the group: revenue per customer, orders per customer, sales per rep. A rate turns "bigger" into "better or worse".
Averages of groups: the trap
Average line value by channel:
| Channel | Order lines | Average line value |
|---|---|---|
| Kiosk | 777 | ₦51,337 |
| Supermarket | 1,308 | ₦160,847 |
| Wholesale | 2,181 | ₦266,055 |
The overall average is ₦194,689. But if you average the three channel averages, you get ₦159,413, which is wrong. That simple average treats Kiosk's 777 lines as if they counted as much as Wholesale's 2,181. To combine averages, go back to the totals: total revenue ÷ total lines.
Compare like with like
Compare January with January, the first half of one year with the first half of the next. Comparing December with January mostly shows the festive season, not performance. And if the data stops at June 2026, compare January to June 2026 with January to June 2025, not with all of 2025.
Rounding
Round for display, not for calculation. If you round each region to one decimal place first and then calculate from the rounded numbers, the last digit of your answer can change. Calculate with the full figures, then round the result.
Example
Revenue by region, first half (January–June) of each year, in millions of naira:
| Region | H1 2025 | H1 2026 |
|---|---|---|
| Lagos | 118.2 | 152.8 |
| South West | 28.9 | 51.7 |
| North Central | 25.3 | 27.2 |
| South South | 19.7 | 23.1 |
| South East | 20.9 | 19.4 |
| North West | 31.1 | 16.6 |
| Total | 244.2 | 290.7 |
Growth. (290.7 − 244.2) ÷ 244.2 × 100 = 19.0%. The business grew. (From the unrounded totals, ₦244,163,070 and ₦290,730,455, it's 19.1%: an example of rounding changing the last digit.)
Share. Lagos brought in 152.8 ÷ 290.7 × 100 = 52.6% of H1 2026 revenue (52.5% from the unrounded figures): more than half the business comes from one region. A year earlier it was 48.4%. Kolanut is depending more on Lagos, not less.
The exception. North West went the other way, from 31.1 to 16.6: a fall of (31.1 − 16.6) ÷ 31.1 × 100 = 46.6%. A total that grew 19% hides a region that nearly halved. That's why analysts always break totals down.
A rate explains it. North West had 10 ordering customers in H1 2025 and 11 in H1 2026, so it didn't lose customers. But its order lines fell from 176 to 91. Lines per customer fell from 17.6 to 8.3: the same shops ordered less than half as often.
Walkthrough
Mean versus median on real data. Across all 4,266 of Kolanut's order lines:
- The mean order line is worth ₦194,689.
- The median order line is worth about ₦166,680.
The mean is higher because wholesalers place many very large orders (up to ₦713,400 on a single line), which pull the average up. If a manager asks "what does a typical order line look like?", the median is the more honest answer.
Averages by group often tell the real story. Average quantity per order line:
| Channel | Average packs per line |
|---|---|
| Wholesale | 19.0 |
| Supermarket | 11.1 |
| Kiosk | 3.6 |
One overall average (13.8 packs) would describe none of these customers well.
Try it yourself. In a spreadsheet with orders.csv:
- Add a revenue column with the formula above.
- Calculate the total, count, mean and median of revenue. Check you get ₦830,541,245, 4,266, ₦194,689 and ₦166,680.
- Find the minimum and maximum. Do they look sensible?
- Work out what share of all revenue came from the single largest line (713,400 ÷ 830,541,245 × 100). It's tiny, under 0.1%, so no one line distorts the total, even though big lines do lift the mean.
Summary
| Need | Use |
|---|---|
| How much / how many | Total / count / distinct count |
| A typical value | Median for skewed data; mean when you need totals |
| A quick sanity check | Minimum and maximum |
| Part of a whole | Share = part ÷ total × 100 |
| Change over time | Growth = (new − old) ÷ old × 100 |
| Fair comparison of different-sized groups | A rate: per customer, per rep |
| Combining group averages | Recalculate from totals; never average averages |
Practice
Practice
Using the table in the Example, what share of H1 2026 revenue came from the South West, to one decimal place?
Practice
By what percentage did North West revenue fall from H1 2025 to H1 2026? Give the size of the fall as a positive number, to one decimal place.
Practice
In orders.csv, what is the average quantity per order line, to one decimal place?
More practice
Optional drills. They don't count towards the certificate, but they're the fastest way to make this lesson stick. Several use a different dataset from the lesson on purpose: if you can do the same thing on unfamiliar data, you've really learned it.
Drill · optional
In the HR employees.csv, what is the average monthly salary of Senior staff? Round to the nearest naira.
Drill · optional
In the legal invoices.csv, what is the average invoice amount? Round to the nearest naira.
Check your understanding
Answer every question to check.