Module 7 · Data Analytics Foundations
Data visualization
How people read charts, which chart answers which question, the parts of a chart, colour, misleading charts, and the habits that make a chart clear in five seconds.
About 20 minutes
The problem
You've found that North West revenue nearly halved while the rest of the business grew. You could say it in a sentence, but the sales director will remember a chart. The wrong chart, though, can hide the finding or even suggest the opposite.
The concept
A chart is a way of making one point quickly. Good charts are chosen for the question, designed so the eye goes straight to the point, and honest about the numbers.
How people read charts
A chart turns numbers into something the eye can compare: positions, lengths, angles, areas, colours. People judge some of these much more accurately than others:
| Encoding | How accurately people compare it | Used in |
|---|---|---|
| Position along a common scale | Very accurately | Line charts, dot plots, scatter plots |
| Length from a common baseline | Very accurately | Bar charts |
| Angle and area | Poorly | Pie and donut charts, bubbles |
| Colour intensity | Roughly | Heat maps |
That's the reason behind most chart advice. Bars and lines use position and length, which we read well; pies use angles, which we don't. When the comparison matters, use bars or lines.
Pick the chart from the question
| Question | Chart | Kolanut example |
|---|---|---|
| How does something change over time? | Line chart | Monthly revenue, January 2025 to June 2026 |
| How do categories compare? | Bar chart (horizontal bars for long labels) | Revenue by region |
| How do two periods compare, by category? | Paired bars | Each region, H1 2025 against H1 2026 |
| What is it made of? | Stacked bar or, for 2–4 parts, a pie/donut | Revenue split by channel |
| Are two measures related? | Scatter plot | Credit limit against amount ordered, per customer |
| How are values spread out? | Histogram | Order line values in ₦50,000 bands |
| What is the one number? | Big number (card) with a comparison | "₦290.7m, up 19% on H1 2025" |
| Exact values to look up | Table | Revenue by product and month |
A table is the right choice more often than people think: when the reader needs exact numbers rather than a pattern, give them a table.
The parts of a chart
| Part | Job | Habit |
|---|---|---|
| Title | Tells the reader what to see | Write the finding, not the topic |
| Subtitle | Says what's measured | "Revenue, January to June, ₦ million" |
| Axes | Give the scale | Start bar charts at zero; label units once |
| Data labels | Exact values where they matter | Label the bars or points you discuss, not every one |
| Legend | Decodes colours | Prefer labelling series directly |
| Source note | Says where the data came from | Small, at the bottom |
Design habits that make charts clear
- Title with the finding, not the topic: "North West revenue nearly halved" beats "Revenue by region".
- Start bar charts at zero. A bar's length is its value; cutting the axis makes small differences look huge.
- Sort bars from largest to smallest unless the categories have a natural order (months, job levels, size bands).
- Highlight one thing. Grey for context, one strong colour for the point you're making.
- Label directly instead of using a legend the reader must decode.
- Remove clutter: heavy gridlines, 3D effects, shadows, backgrounds, unnecessary decimals.
- Round sensibly. ₦290.7m, not ₦290,730,455.00, on a chart for a director.
Colour
- Use colour for meaning, not decoration. If every bar is a different colour, the reader looks for a meaning that isn't there.
- Grey is your friend. It lets the highlighted item stand out.
- Red and green together are hard to tell apart for about 1 in 12 men with colour blindness. Pair colour with something else: a label, a position, a shape.
- Be consistent. If Lagos is gold on one chart, keep it gold on the next.
Charts that mislead
Some charts mislead by accident; a careful analyst avoids all of these:
| Problem | Effect | Fix |
|---|---|---|
| Bar axis that doesn't start at zero | A 5% difference looks like 50% | Start bars at zero, or use a line or dot chart |
| 3D charts | Perspective makes near slices or bars look bigger | Always 2D |
| Pie with many slices | Angles can't be compared past four slices | Sorted bar chart |
| Two y-axes | The scales can be chosen to suggest any relationship | Two separate charts, or use sparingly and label clearly |
| Cherry-picked period | Starting the chart at a low point makes any growth look dramatic | Show a fair period and say why you chose it |
| Unequal time gaps | Points spaced evenly when the dates aren't | Use a real date axis |
Example
The same data, two ways:
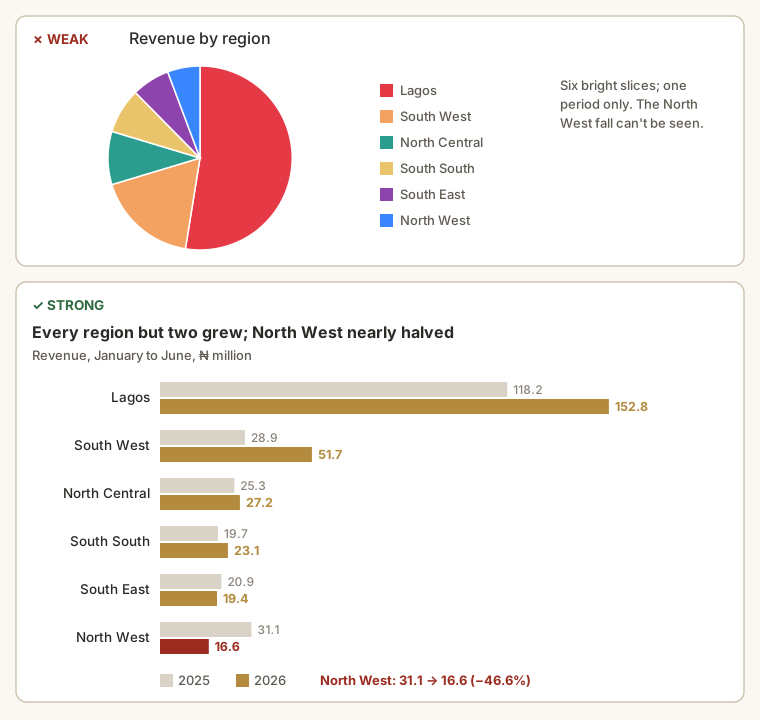
Weak: a pie chart of H1 2026 revenue with six slices, titled "Revenue by region", in six bright colours. Lagos is obviously biggest; nothing else is readable, and the North West fall is invisible because a pie shows only one period.
Strong: a bar chart with each region's H1 2025 bar in light grey and its H1 2026 bar next to it, North West's 2026 bar in red, sorted by 2026 revenue, titled "Every region but two grew; North West nearly halved." The point is visible in five seconds.
What changed? The chart type now matches the question (a comparison over two periods). The title states the finding. Colour is used once, for the point. Nothing was added; the strong version is mostly the weak one with the noise removed and the right comparison put in.
Walkthrough
To build the strong version in a spreadsheet:
- Lay out a small table: region, H1 2025, H1 2026 (the table from the previous lesson).
- Sort it by H1 2026, largest first.
- Select it and insert a clustered bar (or column) chart.
- Colour the 2025 series light grey and the 2026 series dark.
- Click North West's 2026 bar alone and colour it red.
- Replace the default title with the finding, and add a subtitle with the units: "Revenue, January to June, ₦ million".
- Delete the gridlines you don't need, and check the axis starts at 0.
- Add data labels to the 2026 bars only.
Summary
| Need | Use |
|---|---|
| Change over time | Line chart |
| Compare categories | Sorted bar chart |
| Two periods by category | Paired bars |
| Parts of a whole | Stacked bar; pie only for 2–4 parts |
| Relationship between two measures | Scatter plot |
| Spread of values | Histogram |
| One headline number | A card, with a comparison |
| Exact values | A table |
| Every chart | Finding as the title, zero baseline for bars, one highlight, no clutter |
Practice
Practice
The finance manager wants to see how monthly revenue moved from January 2025 to June 2026. Which chart type fits best? (One or two words.)
Practice
A colleague's bar chart of revenue by region has its axis starting at ₦15 million instead of zero. North West (₦16.6m) looks almost empty and Lagos (₦152.8m) enormous. What is the lowest value the axis should start at?
More practice
Optional drills. They don't count towards the certificate, but they're the fastest way to make this lesson stick. Several use a different dataset from the lesson on purpose: if you can do the same thing on unfamiliar data, you've really learned it.
Drill · optional
You're making a bar chart of employees by department from the HR employees.csv (all 80, active or not). Which department is the longest bar?
Check your understanding
Answer every question to check.