Module 2 · Data Analytics Foundations
How businesses use data
Where company data comes from, what makes a good KPI, leading and lagging indicators, and how a KPI tree shows why a number moved.
About 20 minutes
The problem
A new analyst joins Kolanut and asks for "the data". The answer is: which data? Sales keeps orders. The warehouse tracks stock. Finance holds invoices and payments. HR has staff records and attendance. Each team uses its own data to run its own part of the business, and the most useful questions usually need two or more of them together.
The concept
Where business data comes from
Every business activity leaves a record. Most of it is produced by the systems people use to do their jobs, not collected for analysis:
| Source | What it is | Kolanut example |
|---|---|---|
| Transaction systems | Software that records each sale, payment or delivery as it happens | The order system that writes orders.csv |
| ERP (enterprise resource planning) | One system covering finance, stock and purchasing; SAP, Oracle, Odoo and Sage are common | Stock levels and supplier invoices |
| CRM (customer relationship management) | Customers, contacts, visits and deals | The customer list with channel and sales rep |
| HR and payroll systems | Staff, salaries, attendance, leave | employees.csv, attendance.csv |
| Spreadsheets | Anything a team tracks by hand | A rep's list of shops visited this week |
| External data | From outside the company | Exchange rates, inflation, fuel prices |
Each team uses its own data to run its own part of the business:
| Team | Data it produces | Decisions it supports |
|---|---|---|
| Sales | Orders, customers, prices, discounts | Which customers to visit, which products to push |
| Operations | Deliveries, stock levels, routes | How much to reorder, where to position trucks |
| Finance | Invoices, payments, costs | Who to chase for payment, where money is being lost |
| HR | Staff, salaries, attendance, leave | Hiring plans, where people are leaving |
| Marketing | Campaigns, website visits, enquiries | Which channels bring customers |
The most useful questions usually need two or more sources together. "Are our biggest customers paying on time?" needs sales data and finance data. Joining sources is a skill you'll practise in lesson 4 and in the SQL course.
Metrics and KPIs
A metric is any number you can measure: order lines, website visits, calls made. A KPI (key performance indicator) is one of the few metrics a business chooses to watch regularly, because it shows whether things are going well.
Every KPI is a metric; most metrics are not KPIs. A sales team might track fifty metrics and report five KPIs.
A good KPI is:
- Clearly defined. Everyone calculates it the same way.
- Tied to a goal. It moves when the business gets better or worse.
- Actionable. Someone can do something when it changes.
- Timely. It's available often enough to act on: weekly or monthly, not once a year.
The parts of a KPI definition
"Revenue" sounds obvious until two people calculate it differently. A written definition removes the argument:
| Part | Kolanut's revenue KPI |
|---|---|
| Name | Net revenue |
| Formula | Sum of quantity × unit price × (1 − discount ÷ 100), over all order lines |
| Includes / excludes | After discounts; before VAT; all channels |
| Period | Calendar month, reported by the 5th of the next month |
| Source | orders.csv from the order system |
| Target | ₦50m a month in 2026 |
| Owner | Sales director |
The owner matters: a KPI without someone responsible for it is just a number on a slide.
Common KPIs and how they're calculated
| KPI | Calculation | Team |
|---|---|---|
| Revenue | Sum of sales value in a period | Sales |
| Growth rate | (This period − last period) ÷ last period × 100 | Everyone |
| Average order value | Revenue ÷ number of orders | Sales |
| Active customers | Customers with at least one order in the period | Sales |
| On-time delivery rate | Deliveries on time ÷ all deliveries × 100 | Operations |
| Staff turnover | People who left ÷ average headcount × 100 | HR |
| Collection rate | Invoices paid ÷ invoices issued × 100 | Finance |
| Days sales outstanding | Money owed by customers ÷ sales per day | Finance |
Leading and lagging indicators
A lagging indicator tells you what has already happened: revenue, profit, staff who left. It's the result you care about, but by the time it moves, it's too late to change.
A leading indicator moves before the result, so there's time to act:
| Lagging (the result) | Leading (an early warning) |
|---|---|
| Monthly revenue | Orders booked this week; customers who haven't ordered in 30 days |
| Staff turnover | Absence rates; overtime hours |
| Bad debts written off | Invoices more than 30 days overdue |
A good dashboard shows both: the result, and the signals that predict it.
Breaking a KPI into a tree
When a KPI moves, the next question is why. A KPI tree splits it into the parts that multiply to make it, so you can see which part moved.
For revenue: revenue = active customers × order lines per customer × revenue per line. And revenue per line = packs per line × price per pack.
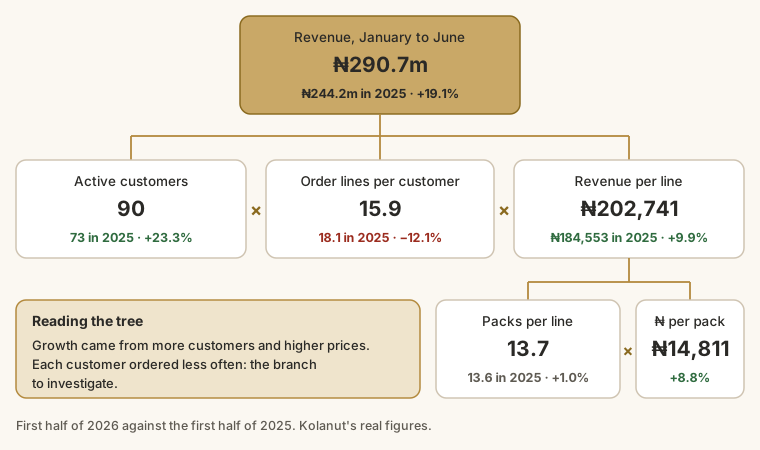
Reading Kolanut's tree, first half of 2026 against the first half of 2025:
- Revenue grew 19.1%, from ₦244.2m to ₦290.7m.
- More customers ordered: 90 against 73, as new shops joined.
- Prices rose: each pack earned 8.8% more, after January's price rise.
- But each customer ordered less often: 15.9 lines against 18.1.
The headline (+19.1%) hides a warning sign. Without the tree, "revenue is up" is the whole story; with it, you know to ask why customers are ordering less often.
Vanity metrics
A vanity metric looks impressive but doesn't help anyone decide anything: total registered customers ever, total social media followers, total app downloads. They only go up, so they always look good.
Ask of any number: if this went down, what would we do differently? If the answer is "nothing", it isn't a KPI.
Example
Three businesses, three uses of data:
- A distributor (Kolanut) compares revenue by region each month. When one region drops, the sales manager calls the rep covering it before the quarter is lost.
- A logistics company tracks on-time delivery by route. A route that is late 30% of the time gets a new schedule or a different carrier.
- A law firm watches outstanding invoices. Partners get a weekly list of clients whose invoices are more than 30 days overdue: a leading indicator for cash problems.
In each case the data isn't collected for analysis. It exists because the business runs. Analytics makes it useful a second time.
Walkthrough
Let's calculate two KPIs by hand for one month at Kolanut.
In a month, Kolanut delivered 1,240 orders. 62 arrived later than promised. Revenue was ₦48,000,000.
On-time delivery rate
- On-time deliveries = 1,240 − 62 = 1,178.
- Divide by all deliveries: 1,178 ÷ 1,240 = 0.95.
- Multiply by 100: 95%.
Average order value
- Revenue ÷ orders = 48,000,000 ÷ 1,240.
- = ₦38,710 (rounded to the nearest naira).
Check it against a target. If the target for on-time delivery is 97%, the month missed it by 2 percentage points: 25 more deliveries would have needed to arrive on time (97% of 1,240 is 1,203; 1,203 − 1,178 = 25). Turning a gap into a count like this makes it concrete for the people who have to fix it.
Summary
| Term | Meaning |
|---|---|
| Metric | Any number you can measure |
| KPI | One of the few metrics the business watches to judge performance |
| KPI definition | Name, formula, inclusions, period, source, target, owner |
| Lagging / leading | The result / an early warning of it |
| KPI tree | A KPI split into the parts that multiply to make it |
| Vanity metric | A number that looks good but drives no decision |
Practice
Practice
The next month, Kolanut delivered 1,500 orders and 90 were late. What was the on-time delivery rate, as a percentage? (Type just the number, for example 92.5.)
Practice
Kolanut had 75 staff at the start of the year and 80 at the end (an average headcount of 77.5). 8 people left during the year. What was staff turnover, to one decimal place?
More practice
Optional drills. They don't count towards the certificate, but each one checks you can apply the lesson to a new situation.
Drill · optional
Kolanut had 80 active customers last year and 90 this year. What is the customer growth rate? One decimal place.
Drill · optional
A warehouse shipped 2,400 orders and 36 came back as returns. What is the return rate? One decimal place.
Check your understanding
Answer every question to check.