Module 1 · Data Analytics Foundations
What is data analytics?
What analysts actually do: data, information and insight, the four kinds of analytics, the data jobs and tools, and the six steps every analysis follows.
About 20 minutes
The problem
Kolanut Distribution sells drinks, snacks and household goods to shops across Nigeria. Every order is written into a system: who bought, what, how many, at what price, on which day. After eighteen months that system holds more than four thousand order lines.
The managing director doesn't want four thousand rows. She wants answers:
- Are we selling more than last year?
- Which regions are growing, and which are slipping?
- Should we keep giving wholesalers 10% discounts?
Turning the rows into those answers is data analytics.
The concept
Data analytics is the work of collecting, cleaning and examining data to answer questions and support decisions.
The word that matters is decisions. A table of numbers is not analysis. Analysis ends when someone can act: restock earlier, call a customer, drop a product, hire in one region instead of another.
Data, information and insight
It helps to separate three things that people often call "data":
| What it is | Kolanut example | |
|---|---|---|
| Data | Raw recorded facts, one event at a time | 10001, 2025-01-01, customer 27, product 3, 14 packs, ₦18,600 |
| Information | Data summarised so it answers "what?" | Revenue in March 2025 was ₦46.3 million |
| Insight | Information that explains "why", and points to "so what?" | March's jump came mostly from drinks; stock more drinks before the next hot season |
An analyst's job is to move up this list. Each step needs judgement: which rows to include, how to summarise them, what to compare them with.
The four kinds of analytics
Analytics questions come in four kinds, each harder than the last:
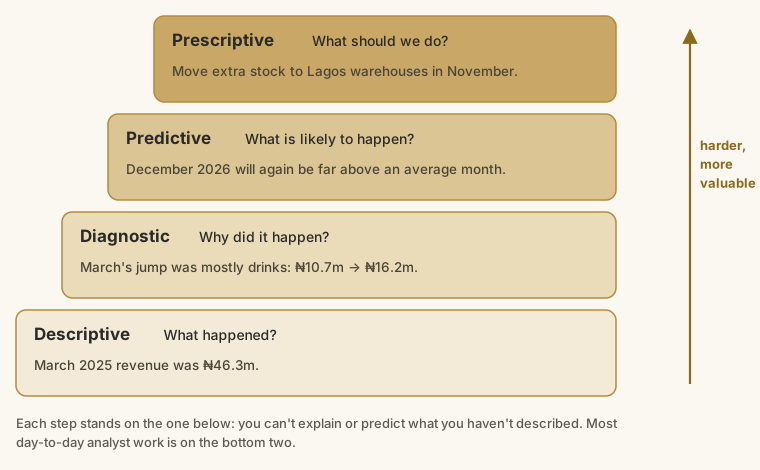
| Kind | Question it answers | Kolanut example | Typical tools |
|---|---|---|---|
| Descriptive | What happened? | Revenue in March 2025 was ₦46.3 million. | Totals, averages, charts, dashboards |
| Diagnostic | Why did it happen? | North West revenue fell because shops there ordered less often, not because we lost them. | Breaking totals down, comparing groups |
| Predictive | What is likely to happen? | December 2026 will again be far above an average month (December 2025 was 47% above 2025's monthly average). | Trends, seasonality, statistical models |
| Prescriptive | What should we do? | Send more stock to Lagos warehouses in November. | Scenarios, optimisation, business judgement |
Most day-to-day analyst work is descriptive and diagnostic. They are the foundation: you can't predict what you haven't described, and a prediction nobody can explain is hard to trust.
Who works with data
"Data analyst" is one of several data jobs. They overlap, but the focus differs:
| Role | Main question | Main tools |
|---|---|---|
| Data analyst | What happened, and why? | Excel, SQL, Power BI or Tableau |
| Business analyst | What does the business need, and how should the process change? | Interviews, process maps, requirements, Excel |
| Data scientist | What will happen? Can we predict or automate it? | Python, statistics, machine learning |
| Data engineer | How do we get reliable data to everyone who needs it? | Databases, SQL, pipelines, cloud tools |
This course is the foundation for all four. The data analyst path is the most common way in.
The tools of the job
| Tool | What it's for | Course here |
|---|---|---|
| Spreadsheets (Excel, Google Sheets) | Small and medium data, quick analysis, sharing with anyone | Excel for Data Analysis |
| SQL | Asking questions of databases, where most company data lives | SQL for Data Analysis |
| BI tools (Power BI, Tableau) | Dashboards that refresh themselves | Power BI Fundamentals |
| Python | Automation, large data, statistics, machine learning | Python for Beginners |
You don't need all of them to start. Spreadsheets and a little SQL already answer most business questions.
The analysis cycle
Every analysis, big or small, follows roughly the same steps:
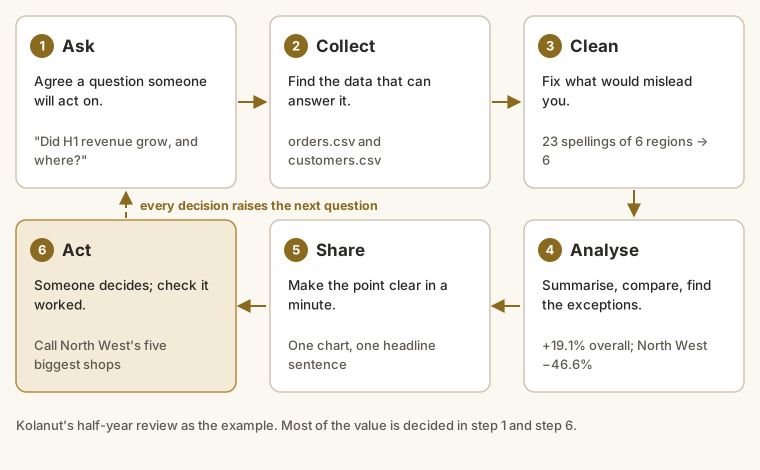
- Ask. Agree the question with the person who will use the answer. "How are sales?" is vague. "Did first-half revenue grow compared with last year, and in which regions?" is answerable.
- Collect. Find the data that can answer it: which system, which tables, which dates.
- Clean. Fix what would mislead you: duplicates, inconsistent spellings, missing values.
- Analyse. Summarise, compare, look for patterns and exceptions.
- Share. Present the finding so the audience understands it in a minute: a clear chart, a short summary.
- Act. Someone makes a decision, and you check later whether it worked. That check usually raises the next question, and the cycle starts again.
Where does the time go? On a typical piece of work, collecting and cleaning take far longer than the analysis itself. Beginners are often surprised by this; experienced analysts plan for it.
Common beginner mistakes
| Mistake | What it looks like | Instead |
|---|---|---|
| Starting with the data | Opening the file and "seeing what's there" | Start with the question and the decision |
| Reporting everything | A 20-page report with every number | Report what answers the question; keep the rest in an appendix |
| Stopping at the total | "Revenue grew 19%" | Break it down: which regions, products, customers? |
| No comparison | "Revenue was ₦290.7m" | Against what? Last year, target, another region |
| Hiding the method | Numbers nobody can check | Say where the data came from and how you calculated |
Example
Here is Kolanut's revenue for the first six months of 2025, rounded to millions of naira:
| Month | Revenue (₦ million) |
|---|---|
| January | 37.1 |
| February | 36.1 |
| March | 46.3 |
| April | 44.6 |
| May | 40.3 |
| June | 39.8 |
A descriptive reading: revenue ranged from ₦36.1m to ₦46.3m, and March was the best month.
A diagnostic question it raises: why was March stronger? Breaking March down by product category answers it: drinks went from ₦10.7m in February to ₦16.2m in March. That ₦5.5m is more than half of the month's ₦10.1m increase; personal care and snacks added the rest, and household goods dipped slightly. The rise was mostly drinks.
A predictive question: will next March be strong too? One year of data is a weak basis; with two or three years, you could see whether March is reliably strong.
A prescriptive suggestion: if the drinks pattern repeats, order more drinks stock in February.
Notice how each step needed the one before: you can only ask why March was strong once you've seen that it was.
Walkthrough
Practise telling the four kinds apart, and turning vague questions into answerable ones.
- Classify. For each question, decide which kind it is:
- "How many order lines did we have in June?" (descriptive)
- "Why did June revenue fall from May?" (diagnostic)
- "How much stock will we need next December?" (predictive)
- "Should we stop giving 10% discounts to wholesalers?" (prescriptive)
- Sharpen a vague question. "How are our customers doing?" can't be answered. Ask: who wants to know, and what will they decide? If the sales director is deciding where to send reps, a good version is: "Which regions had fewer active customers in January to June 2026 than a year earlier?"
- Check it's answerable. A good question names a measure (active customers), a breakdown (by region), a period (January to June 2026), and a comparison (a year earlier).
The rest of this course takes each step in turn. By the end you'll run the whole cycle yourself on real-looking company data.
Summary
| Term | Meaning |
|---|---|
| Data analytics | Using data to answer questions and support decisions |
| Data → information → insight | Raw facts → summaries → explanations that point to action |
| Descriptive / diagnostic | What happened? Why? |
| Predictive / prescriptive | What will happen? What should we do? |
| The analysis cycle | Ask, collect, clean, analyse, share, act |
Practice
Practice
Using the table in the Example, which month in the first half of 2025 had the lowest revenue?
Practice
How many million naira separate the best month from the worst month in that table? Give the answer in millions, for example 3.5.
More practice
Optional drills. They don't count towards the certificate, but each one checks you can apply the lesson to a new situation.
Drill · optional
A shop sold ₦4.2 million in March and ₦3.5 million in April. By what percentage did sales fall? Give the size of the fall as a positive number, one decimal place.
Check your understanding
Answer every question to check.